
Fleet fuel cards can help managers control fuel purchases, reduce transaction-handling work, and turn spending records into useful reports. The strongest business case connects those capabilities to three measurable results: a lower net fuel bill, fewer administrative hours, and better decisions about vehicles and purchasing.
Start with the work your team needs to improve. A rebate matters when enough gallons qualify. A reporting tool matters when it answers a management question. Automation matters when the time recovered exceeds the work required to maintain the system.
Business Fleet Solutions describes Shell Card Business with automated fuel accounting, invoice access, downloadable reports, mobile account management, and transaction details covering driver, location, tax, and fuel type. Its page advertises rebates of up to 6 cents per gallon at Shell stations and lists the billing-cycle tiers shown below. These are provider-described features and advertised rates; confirm eligibility and account terms before budgeting savings.¹
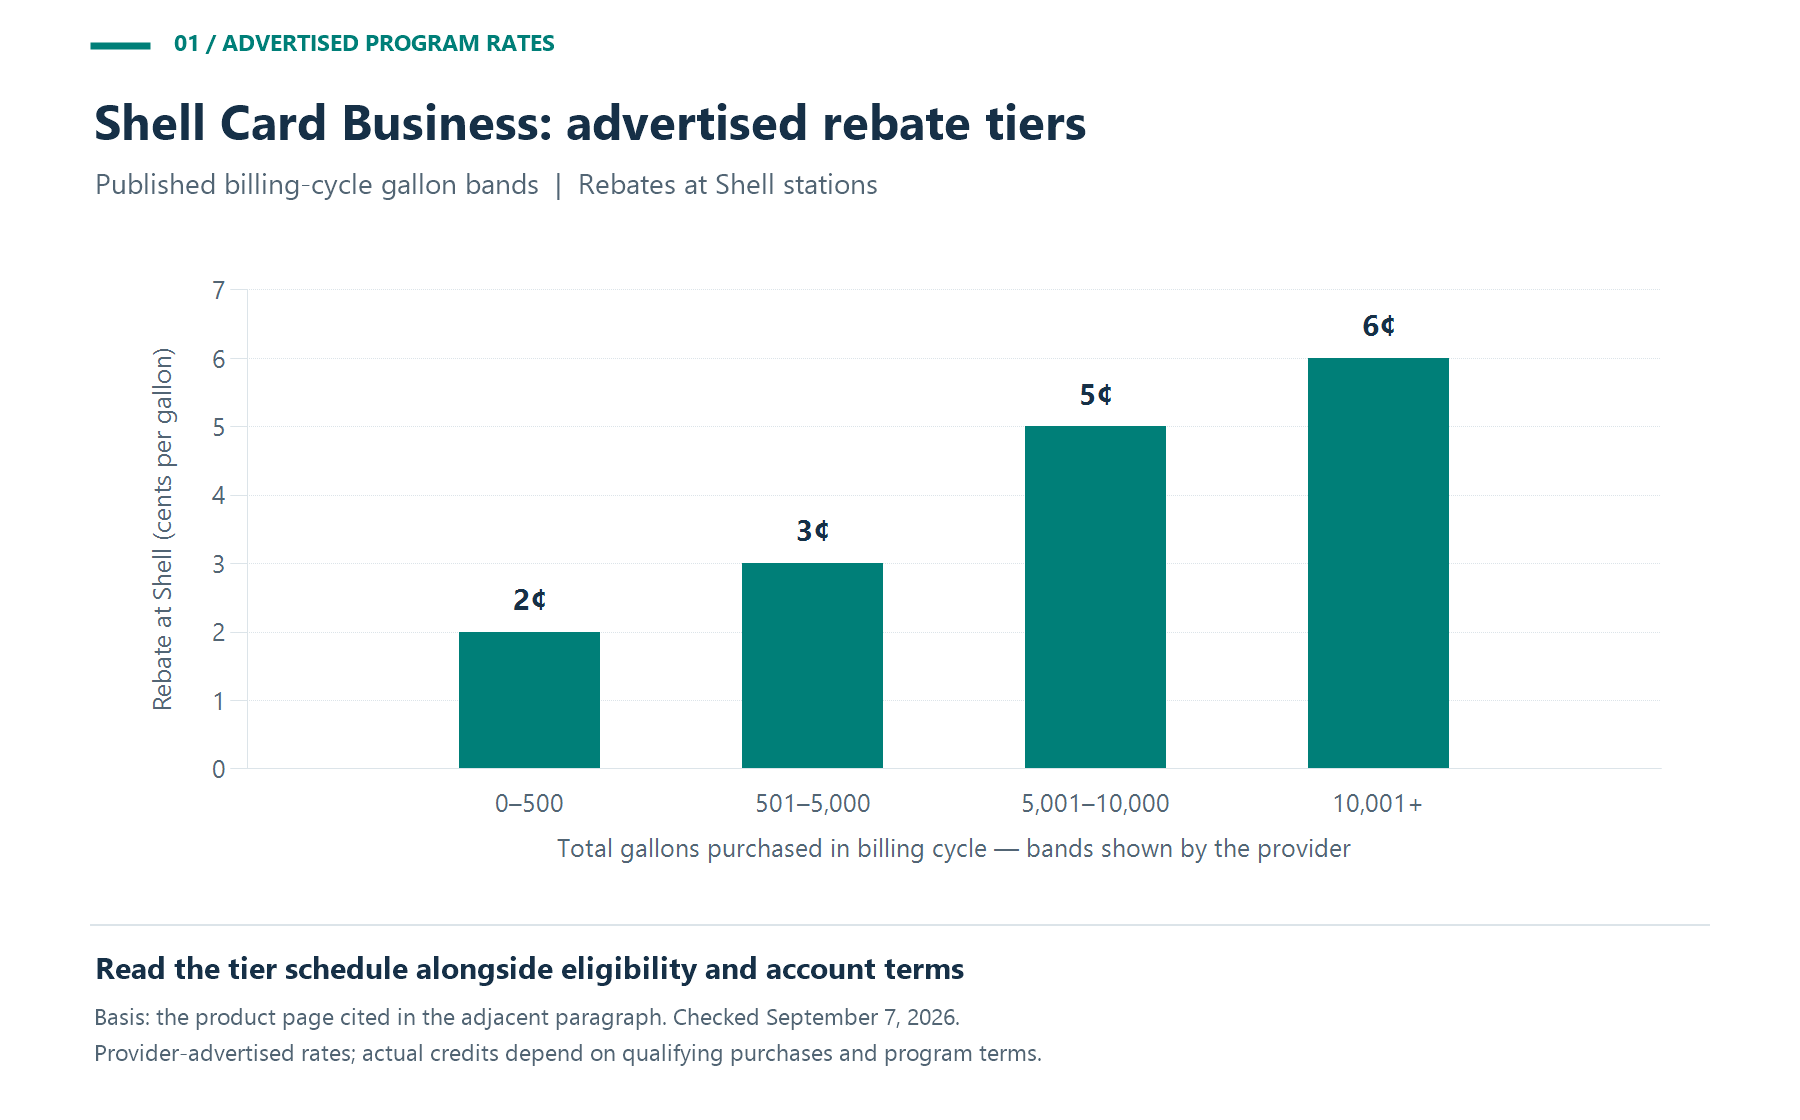
Figure 1. Advertised rebate bands from the product page cited above. Rates apply at Shell, subject to eligibility and program terms.
For a tiered rebate schedule, budget one billing cycle at a time. Check which purchases count toward the volume band and which gallons earn the credit. Annual volume alone should not determine the rate used for every month.
Use those features as the starting point for a demonstration. Ask the provider to walk through a purchase at one of your usual stations, the resulting transaction record, the accounting export, and the process for resolving an exception. A feature list becomes more useful when your fleet manager and accounting team can test the entire workflow.
The starting calculation is straightforward:
Annual fuel rebate = eligible gallons x earned rebate per gallon.
Consider a hypothetical fleet purchasing 100,000 gallons annually, with 80% qualifying for an assumed five-cent rebate. That produces:
100,000 x 80% x $0.05 = $4,000 in annual rebates.
Across all 100,000 gallons, the effective rebate is four cents per gallon. Applying five cents to every gallon would overstate the benefit by $1,000. These are illustrative inputs, not a quote for a particular card. The calculation assumes a constant earned rate; use the applicable rate and eligible volume for each billing cycle when evaluating a tiered program.
A larger rebate does not necessarily produce a lower purchase price. In a hypothetical station comparison, a $3.60 pump price less a five-cent rebate leaves $3.55 per gallon. A suitable station charging $3.48 without that rebate remains seven cents cheaper. For a 25-gallon fill-up, the difference is $1.75.
Evaluate station choices along the routes your drivers already use. Include any extra mileage, waiting time, or access restrictions in the decision. For perspective, ten additional minutes valued at an assumed $30 per hour represents $5 of driver time before extra vehicle costs.
Ask each provider to price a representative month of actual fuel purchases. Separate gasoline and diesel, identify qualifying locations, apply the applicable rebate tiers, and include every proposed fee. Compare the result with the current payment method, including rewards or discounts you already receive.
Ask each provider which purchase limits its program supports and request a demonstration. Configure the available settings around vehicle tank capacity, approved fuel products, working hours, and legitimate emergency needs. Assign responsibility for reviewing exceptions and helping drivers resolve valid declined purchases.
Keep an exception log with the purchase, reason for review, supporting information, and resolution. Count an avoided or recovered expense only when the amount and circumstances are confirmed. Do not assign every flagged transaction a fraud-loss value.
Start by timing the current process: retrieving purchase details, identifying the driver or vehicle, assigning a cost center, checking the charge, and reconciling it with the general ledger. Then test how much of that work the proposed transaction feed and reporting tools remove.
Suppose a fleet processes 400 fuel transactions per month. If average handling time falls from four minutes to one minute, the calculation is:
400 x (4 - 1) / 60 = 20 hours recovered per month.
That is 240 hours annually. At an assumed fully loaded labor cost of $35 per hour, the recovered capacity has a value of $8,400 per year. All of these inputs are hypothetical; the time reduction must be measured in the fleet's own workflow.
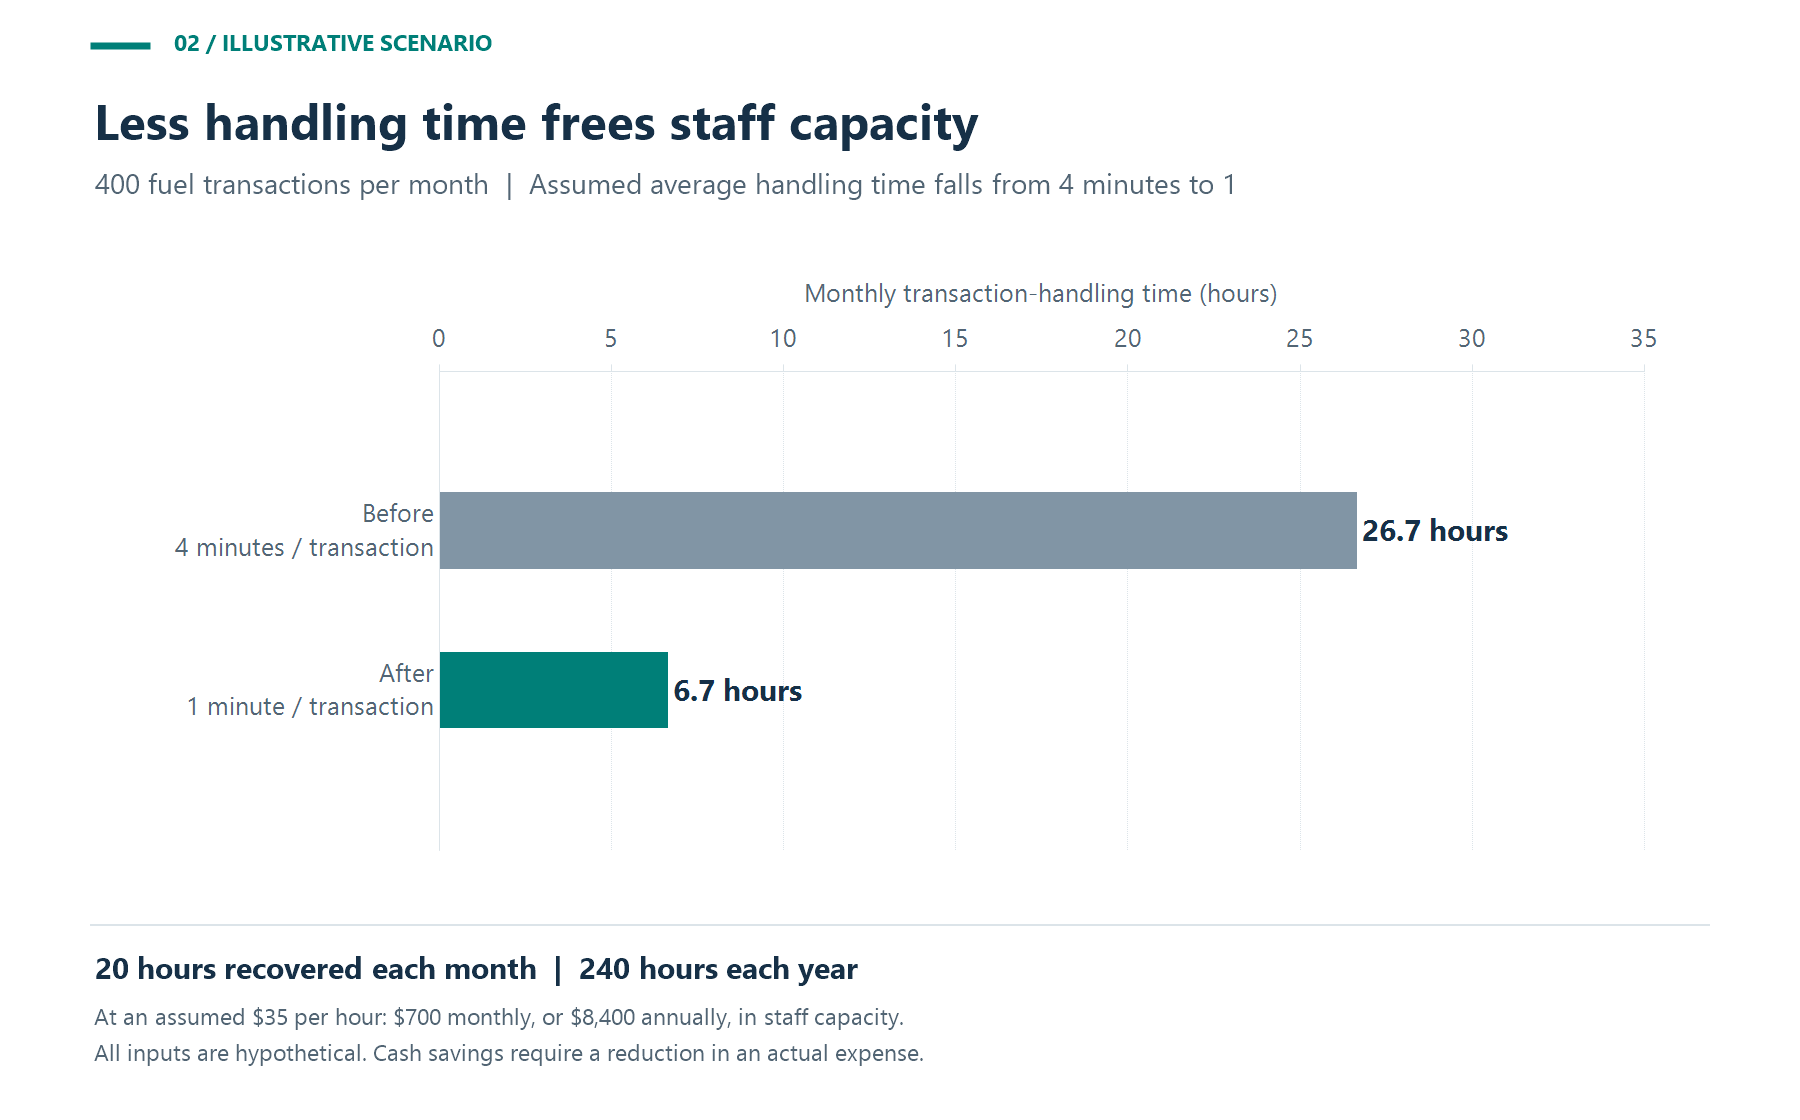
Figure 2. Hypothetical monthly administrative workload. The exact difference is 20 hours; displayed totals are rounded to one decimal place.
Twenty recovered hours can be valuable even when payroll stays the same. The team might use them to resolve maintenance issues, improve dispatch coordination, or finish the monthly close sooner. Report that benefit as additional capacity and identify the work it enables.
Cash savings require an actual expense reduction, such as less paid overtime or a smaller outsourced processing bill. Avoid treating the same recovered hours as both reduced payroll and additional staff capacity.
Include the remaining work when timing a pilot: correcting vehicle assignments, resolving disputes, reviewing exceptions, confirming rebate credits, and checking accounting imports. A faster import is useful only if the complete process takes less effort.
GSA SmartPay's fleet reporting guidance describes account-activity and exception reports, detailed transaction files for financial processing, invoice-status reports, and dispute tracking. It states that most electronic reports update within two to three days after a transaction, while some update at the end of the billing cycle. This is a federal-program example; commercial providers may offer different reporting schedules and features.²
For a commercial fleet, use a small report set with a named owner and a clear next action. The following is a recommended design, not a promise that every card platform supplies each report automatically.
| Report | Suggested contents | Manager's next action |
|---|---|---|
| Fuel spend by vehicle | Vehicle number, gallons, fuel dollars, credits, and comparable mileage | Investigate changes among vehicles doing similar work |
| Net price by station | Fuel grade, gallons, purchase price, and earned rebates | Review approved fueling locations |
| Purchase exceptions | Unusual amounts, timing, products, or locations | Document and resolve individual discrepancies |
| Department or job costs | Vehicle assignment, cost center, and allocated expense | Improve budgeting and cost allocation |
| Rebate reconciliation | Eligible volume, expected credit, and posted credit | Resolve missing or incorrect rebates |
| Processing workload | Handling time, corrections, and unresolved items | Confirm whether automation saves total staff time |
Use quantity-weighted calculations. Buying ten gallons at $3 and ninety gallons at $4 produces an average price of $3.90 per gallon: total cost of $390 divided by 100 gallons. Simply averaging the two posted prices gives $3.50 and misrepresents the actual purchase mix.
A practical review schedule is daily attention to urgent exceptions, weekly review of station-price patterns, and monthly reconciliation of costs and credits. Adjust that schedule to the fleet's workload. Confirm when authorizations appear, when final transaction details arrive, and when accounting exports become available.
The U.S. Department of Energy's FleetDASH methodology illustrates the information available in a federal fuel-card dataset: vehicle fuel type, purchased fuel, purchase date, station location, fuel quantity, and organizational assignment. DOE also documents delayed or missing purchases, miscoded fuel types, inaccurate station coordinates, and incorrect vehicle information. Those limitations provide concrete reasons to validate an apparent discrepancy before acting on it.³
Before adopting a reporting system, request sample records from your operation. Check vehicle identifiers, fuel units, cost-center mappings, credits, and off-card purchases. Reconcile totals with the invoice and investigate gaps before using the dashboard to evaluate a department or driver.
For driver accountability, define exactly what the record establishes. Identify the credential associated with the purchase and check who was assigned to the vehicle. If a decision depends on the vehicle's route or location, request compatible vehicle-location evidence and test that integration separately. Avoid treating the station address as proof of the vehicle's movements between purchases.
Keep cash benefit and staff-capacity value visible as separate measures:
Net cash benefit = incremental purchase savings + verified expense reductions - incremental program costs.
Total economic value = net cash benefit + value of productive staff capacity recovered.
The hypothetical first-year example below combines the earlier rebate and time calculations. It assumes 50 vehicles, 100,000 annual gallons, 80% rebate eligibility, and no rebate under the current payment method. Pump prices and routes remain unchanged. Every fee is an illustrative assumption, not a provider price.
| First-year item | Calculation | Annual amount |
|---|---|---|
| Fuel rebates | 80,000 eligible gallons x $0.05 | $4,000 |
| Card fees | 50 cards x $2 per month x 12 | -$1,200 |
| Reporting or integration charges | $25 per month x 12 | -$300 |
| Setup and training | Assumed one-time expense | -$300 |
| Net cash benefit | $4,000 - $1,800 | $2,200 |
| Value of recovered staff capacity | 20 hours per month x $35 x 12 | $8,400 |
| Total economic value | $2,200 + $8,400 | $10,600 |
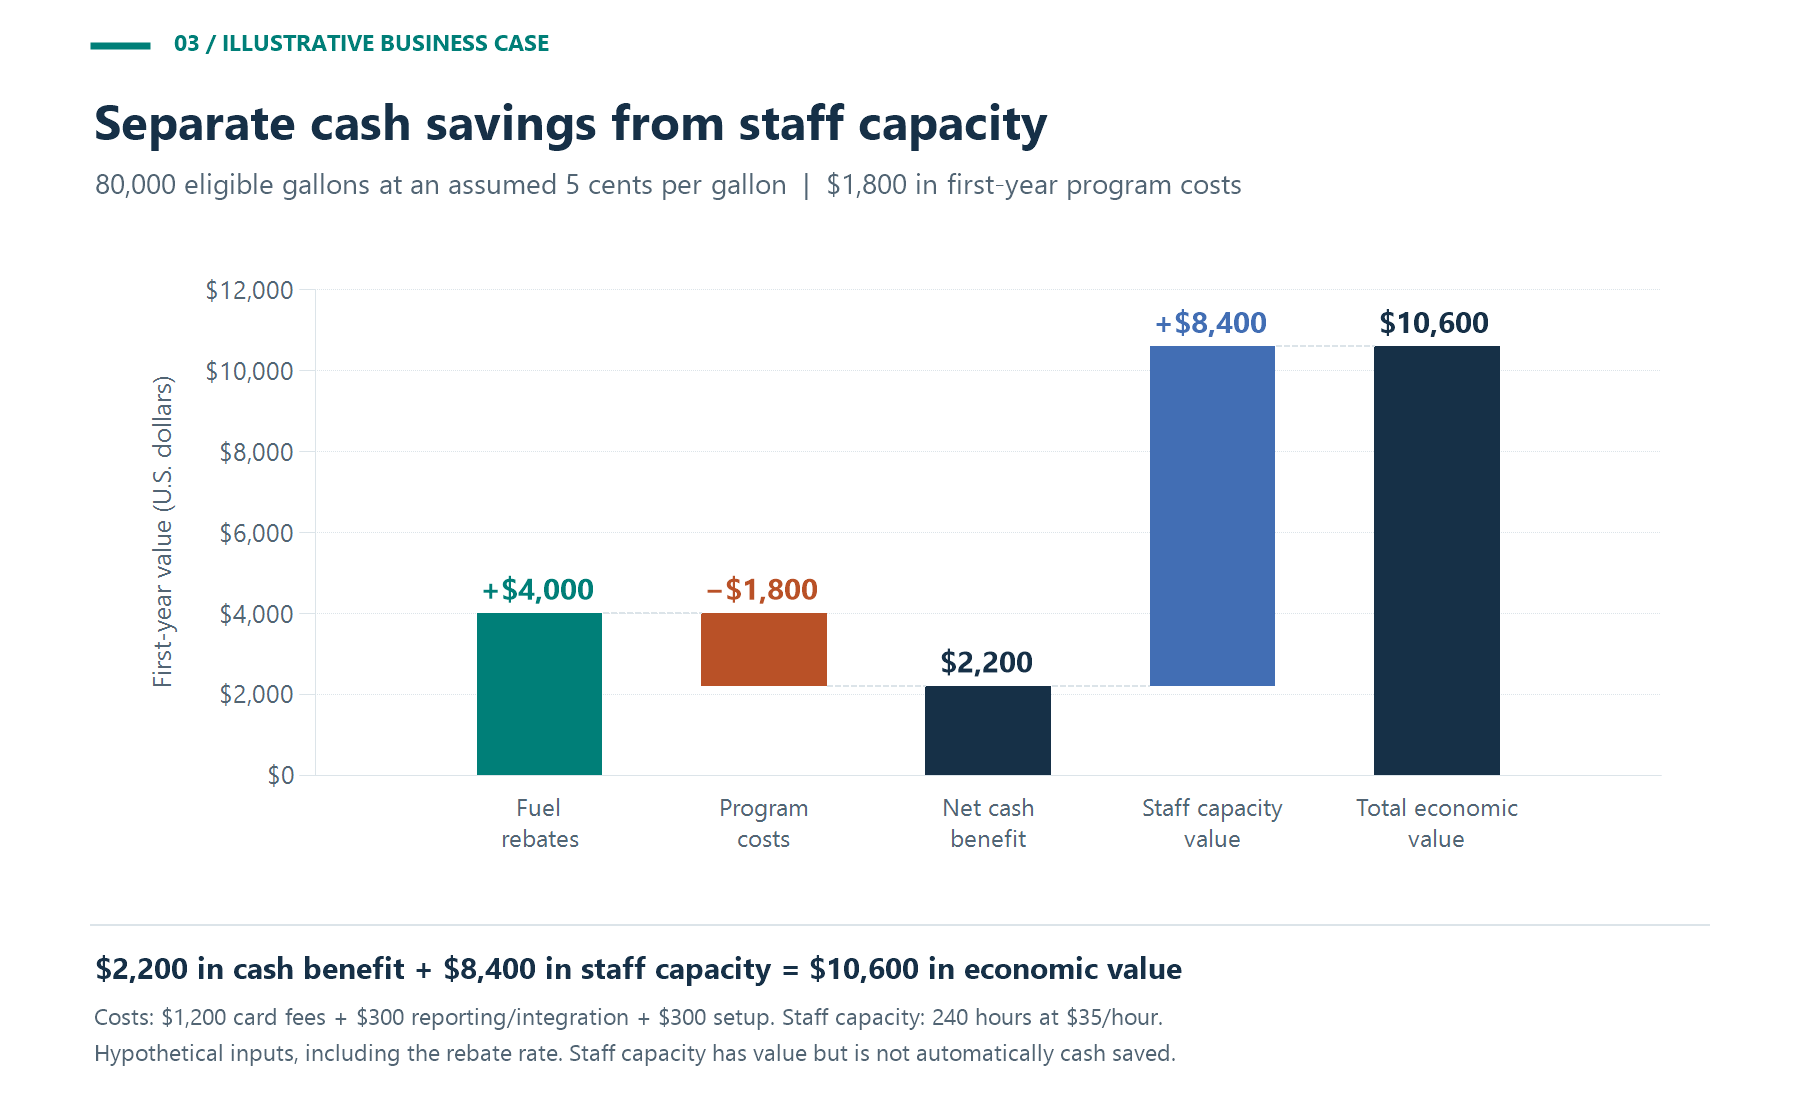
Figure 3. Illustrative first-year cash benefit and staff-capacity value. Floating bars are additions or deductions; net cash benefit and total economic value are subtotals, so the five bars should not be added together.
The $10,600 total includes staff capacity; the modeled cash benefit is $2,200. The example assigns no dollar benefit to fraud prevention, driver behavior, or reporting-driven operational improvements because those outcomes have not been measured.
Test the assumptions before choosing a card. At a two-cent rebate on the same 80,000 eligible gallons, rebates would total $1,600 and the first-year cash result would be negative $200. The rebate-only break-even rate is:
$1,800 / 80,000 = 2.25 cents per eligible gallon.
Add any other incremental charges to the cost calculation and deduct rewards you would otherwise earn. Include any applicable financing costs and any separate software subscription needed to achieve the administrative savings.
Use a representative set of vehicles, drivers, stations, and accounting tasks. Set success measures before the pilot begins so the evaluation does not depend on a favorable-looking dashboard after the fact.
Record eligible gallons, final purchase prices, earned rebates, fees, processing minutes, unresolved transactions, and additional fueling travel. Keep track of changes in routes and workload. Compare the proposed arrangement with the current process over comparable activity.
At the end, answer three questions: Did net purchasing costs fall? Did total administrative effort fall? Did the reports produce useful, documented actions? Expand the program when the measured benefit justifies the cost and someone owns the ongoing reconciliation and review work.
Fleet fuel cards earn their place when purchasing controls, transaction data, and reporting translate into results a manager can verify. The goal is a clearer fuel budget, less repetitive administration, and better decisions supported by complete records.
Sources checked September 7, 2026.
1. Business Fleet Solutions: Shell Card Business | Fleet Fuel Card For Small Business Savings.
https://www.businessfleetsolutions.com/fuel-card/shell-card-business/
2. GSA SmartPay: Lesson 5 - Reporting Tools.
https://training.smartpay.gsa.gov/training_fleet_pc/lesson05/
3. U.S. Department of Energy: FleetDASH Data Processing Methodologies.
https://afdc.energy.gov/FleetDASH/